


The XRP Ledger (XRPL) has rapidly evolved beyond payments to become a fully functioning DeFi and tokenization ecosystem. Yet, with this expansion comes a growing challenge: accessing reliable, real-time on-chain data for traders, liquidity providers, and token issuers.
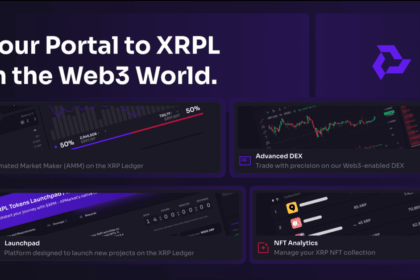
XPMarket addresses this gap by offering the most advanced On-Chain Metrics Dashboard for the XRPL. This powerful toolset provides deep, transparent insights into market activity, token health, liquidity, and trading volume—all in real-time.
In this article, we explore how XPMarket’s On-Chain Metrics Dashboard is empowering XRP Ledger participants with data-driven decision-making tools, setting a new standard for transparency and user control.
What Is XPMarket’s On-Chain Metrics Dashboard?
XPMarket’s On-Chain Metrics Dashboard is a comprehensive analytics suite that tracks real-time blockchain data across the XRPL. It allows users to:
- Monitor token performance
- Analyze liquidity pools
- Track market depth and order books
- View live trading volumes
- Assess project activity and trustlines
This enables traders, investors, and developers to make informed decisions backed by on-chain transparency.
Core Features of the Dashboard
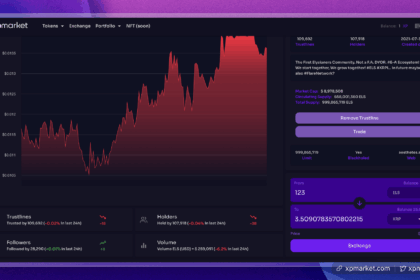
✅ Token Performance Analytics
- Live price tracking
- 24h/7d volume data
- Circulating supply insights
- Market cap estimates
✅ Liquidity Pool Insights
- Current liquidity depth
- Top liquidity providers
- Price impact estimates
- Liquidity trends over time
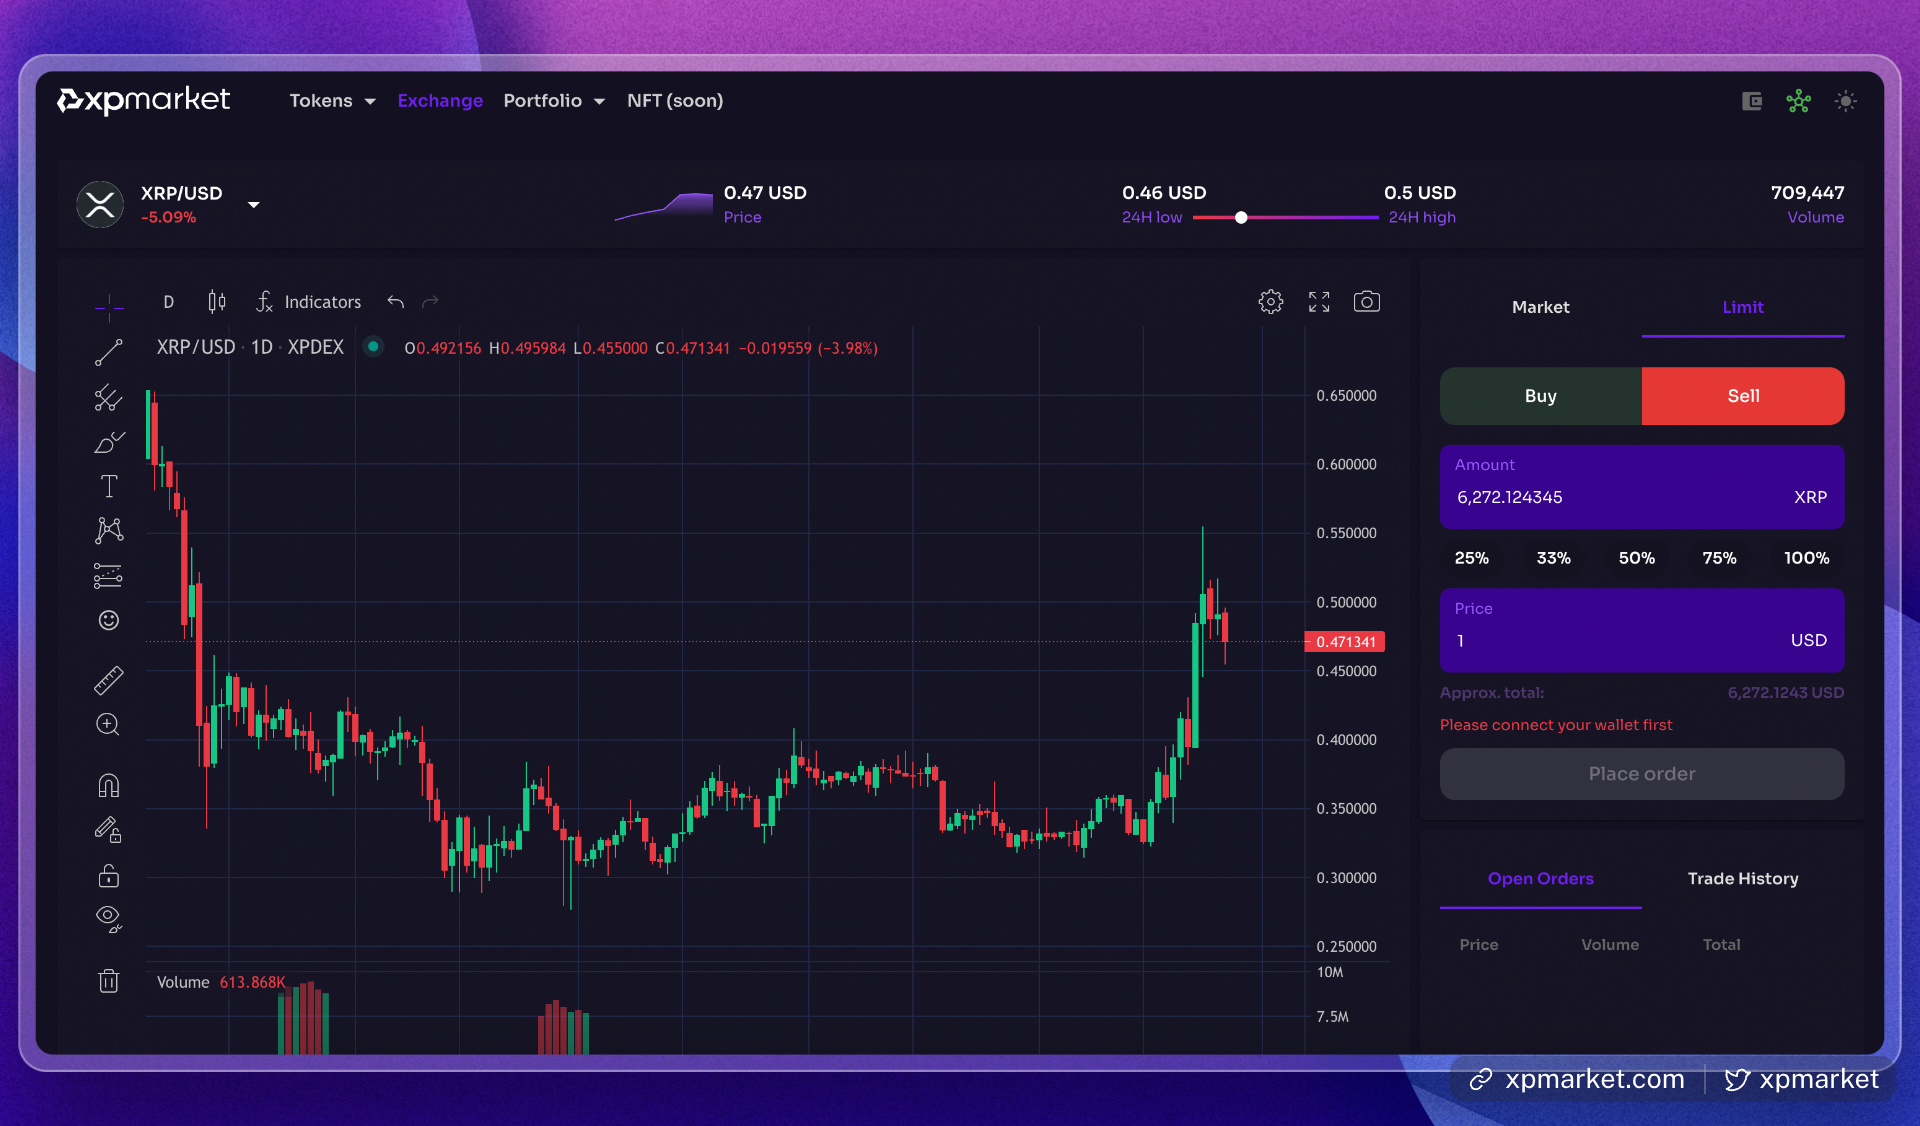
✅ Order Book & Market Depth
- Live bid/ask spreads
- Market depth visualization
- Slippage risk indicators
✅ Trustline and Holder Data
- Active wallet addresses
- Trustline growth over time
- Top token holders
✅ Project Activity Monitoring
- Recent transactions
- Developer activity
- Token governance events
Why On-Chain Transparency Matters on XRPL
🏦 For Traders
- Identify high-liquidity markets to reduce slippage.
- Track real-time price movements and market depth.
🧑💼 For Token Issuers
- Monitor trustline adoption and holder activity.
- Assess liquidity health and community engagement.
🌍 For Developers
- Analyze network usage patterns.
- Identify ecosystem gaps for new product opportunities.
Example Use Case: Assessing Token Health
Imagine you’re considering investing in a new XRPL token.
With XPMarket’s Dashboard, you can instantly:
- Check liquidity depth to ensure you can enter/exit without major price impact.
- Analyze holder distribution to spot potential whale dominance.
- Review recent transaction activity to gauge project traction.
- Monitor price stability and volume over time.
This real-time insight helps avoid rug pulls, low-liquidity traps, and inactive projects.
How XPMarket Outperforms Traditional Block Explorers
| Feature | XPMarket On-Chain Dashboard | Traditional XRPL Explorers |
|---|---|---|
| Live Price & Volume Data | Yes | Limited or None |
| Liquidity Pool Analytics | Yes | None |
| Order Book Insights | Yes | None |
| Trustline Tracking | Yes | Basic |
| Project Activity Feed | Yes | None |
| User-Friendly Interface | Advanced | Basic |
XPMarket’s Role in XRPL Ecosystem Growth
By offering institutional-grade analytics, XPMarket helps:
- Professionalize XRPL trading
- Boost token issuer accountability
- Empower community governance
- Support ecosystem transparency
As XRPL’s DeFi and tokenization sectors grow, XPMarket’s tools provide the data infrastructure needed to build user trust and market efficiency.
Final Thoughts
XPMarket’s On-Chain Metrics Dashboard is more than just a data feed—it’s a strategic advantage for anyone navigating the XRPL. From traders seeking liquidity to projects tracking adoption, XPMarket empowers the community with real-time, actionable insights.
With the XRP Ledger poised for institutional adoption, XPMarket’s commitment to transparent, user-friendly analytics ensures it remains the data backbone of the XRPL economy.
At RippleXity, we’ll continue to spotlight platforms like XPMarket that are advancing open, data-driven finance on the Ripple blockchain.